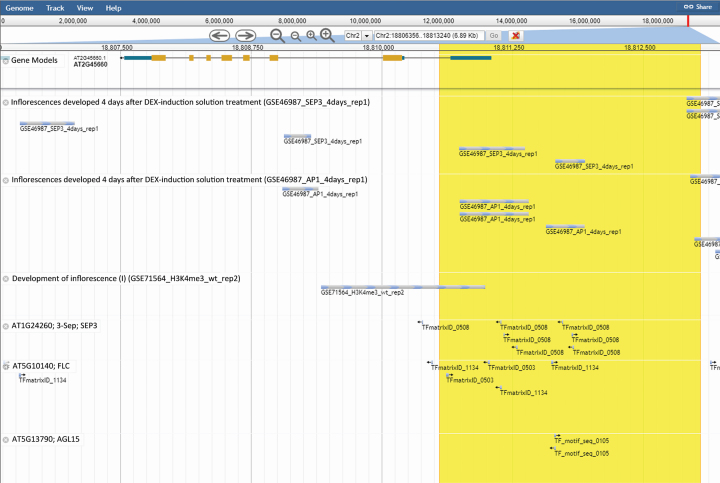
Figure 2.
The binding sites for SEP3, AP1, H3K4me3, FLC, and AGL15 across SOC1 gene (AT2G45660) in the Jbrowse viewer. The upstream region (+500 to -2000; Chr2:18813047–18810548) of SOC1 is highlighted with a yellow background. The experimental binding sites from ChIP-seq are shown in the first three tracks. The last three lines are the predicted TFBSs via PWM patterns.

