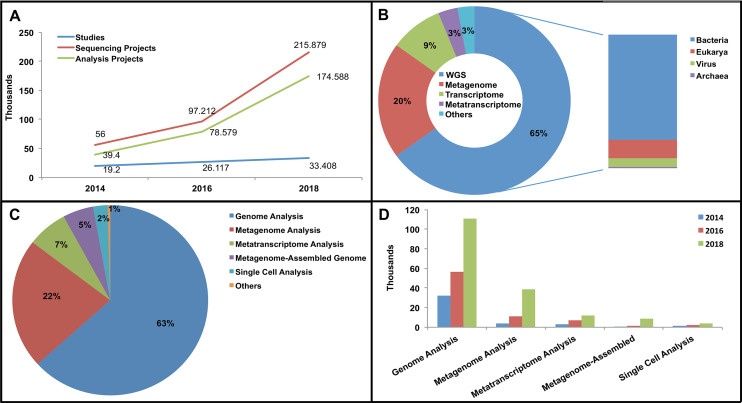
Figure 2.
GOLD by the numbers. (A) Growth in Studies, Sequencing Projects and Analysis Projects during the last three releases of GOLD database. (B) Pie diagram showing distribution of Sequencing Project types in the current version. Vertical panel on the right displaying domain level distribution of organisms for WGS. (C) Different types of Analysis Projects and their percentage breakdown in the current release of GOLD. (D) Growth of different Analysis Project types during the last three releases.

