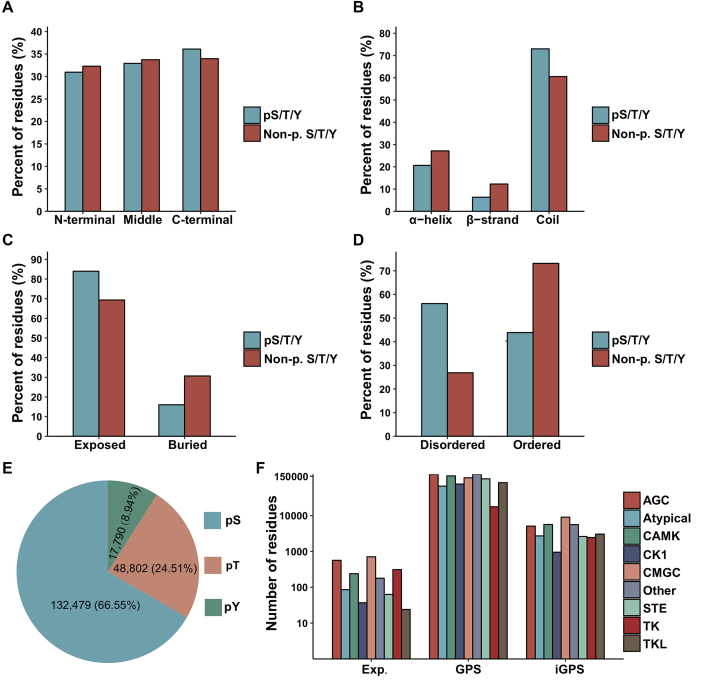
Figure 2.
Summary of the sequence and structure preferences and kinase families of the quantified phosphorylation sites, including the summary of the position along the protein sequence (A), secondary structure (B), surface accessibility (C), disorder region (D), serine/threonine/tyrosine (E) and regulator kinase family (F) for the quantified phosphorylation sites.

