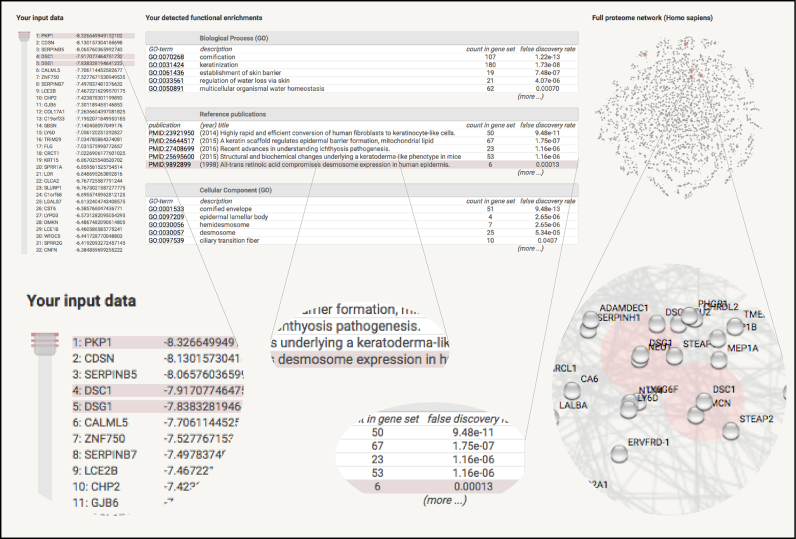
Figure 2.
Functional enrichment analysis of a genome-sized input set. An expression dataset comparing metastatic melanoma cells with normal skin tissue (62) has been submitted to STRING, with average log fold change values associated to each gene (negative values signify depletion in the melanoma cells). The screenshot shows how STRING presents and groups statistical enrichment observations for a number of pathways and functional subsystems. When hovering with the mouse, the website highlights the corresponding proteins both in the input data on the left side, as well as in the organism-wide network on the right side. The latter can be interactively zoomed until individual proteins and their neighbors become discernible. Here, the highlighted observation shows that the desmosome is downregulated in melanoma cells—this stands out by way of several publications in PubMed whose discussed proteins (desmosome proteins) are strongly enriched at one end of the user input.

