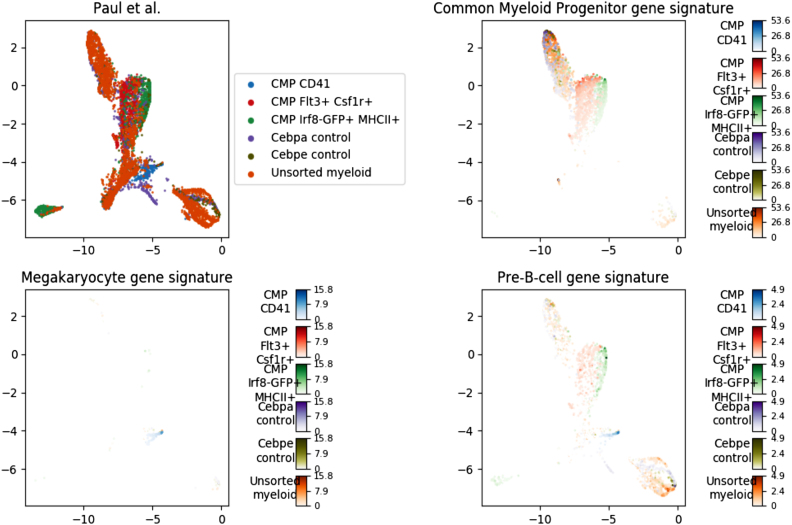
Figure 1.
UMAP embeddings of the expression levels of the cells from Paul et al. study visualized on two dimensions. (A) all cells are visualized, colour corresponds to the type, as can be seen on legend. (B–D) The intensity of the expression levels of cells is computed as the mean of an expression score function across all genes of the signatures Common Myeloid Progenitor (B), Megakaryocyte (C) and Pre-B-cell (D). As it is shown in the colour bar, more intense colour corresponds to higher expression levels. Colour intensities are logarithm of the expression multiplied by expression (x log x) and was chosen for visualization of expression, to help differentiate between regions with different expression levels.

