Figure 3.
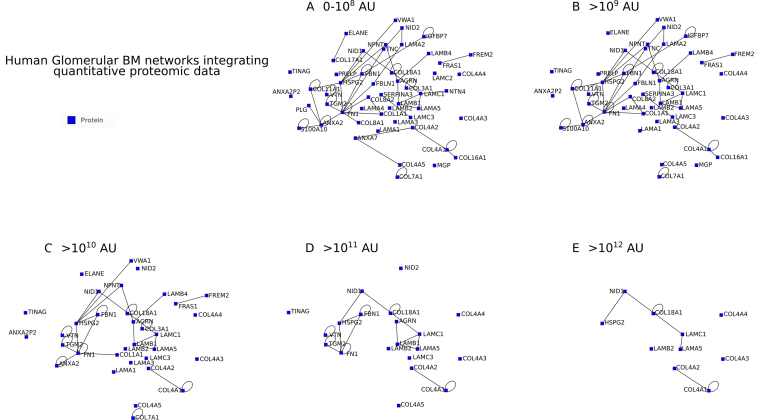
Interaction network of the human glomerular basement membrane integrating quantitative proteomic data (i.e. different threshold values of peptide abundance). The human glomerular basement membrane network was built with different threshold values of peptide abundance in arbitrary units (AU): 0–108 (A), >109 (B), >1010 (C), >1011 (D) and >1012 (E).

