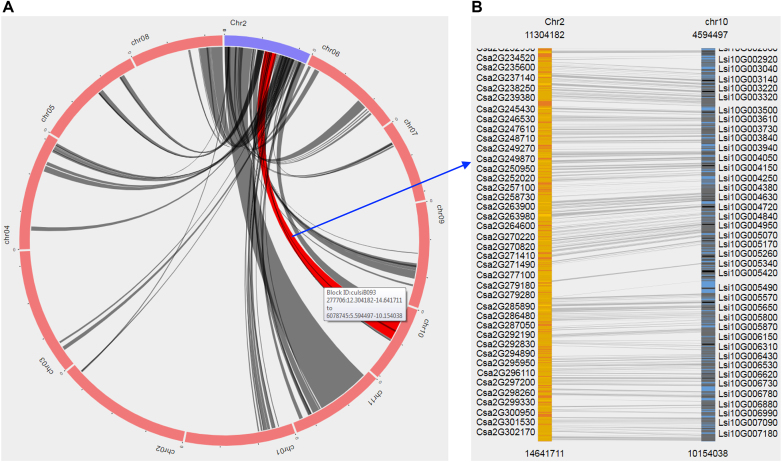
Figure 2.
Synteny viewer in CuGenDB. (A) Synteny blocks displayed in circos plot. Blue arc indicates the query chromosome and red arcs indicate chromosomes of a compared genome. Dark grey lines between blue and red arcs indicate synteny blocks identified between the two genomes. The line will be changed to red when mouse over. (B) View of the selected synteny block. The query and compared chromosomes of the selected synteny blocks are shown in orange and blue, respectively. The yellow and black lines within each chromosome indicate homologous gene pairs, which are connected by grey lines.

