Figure 1.
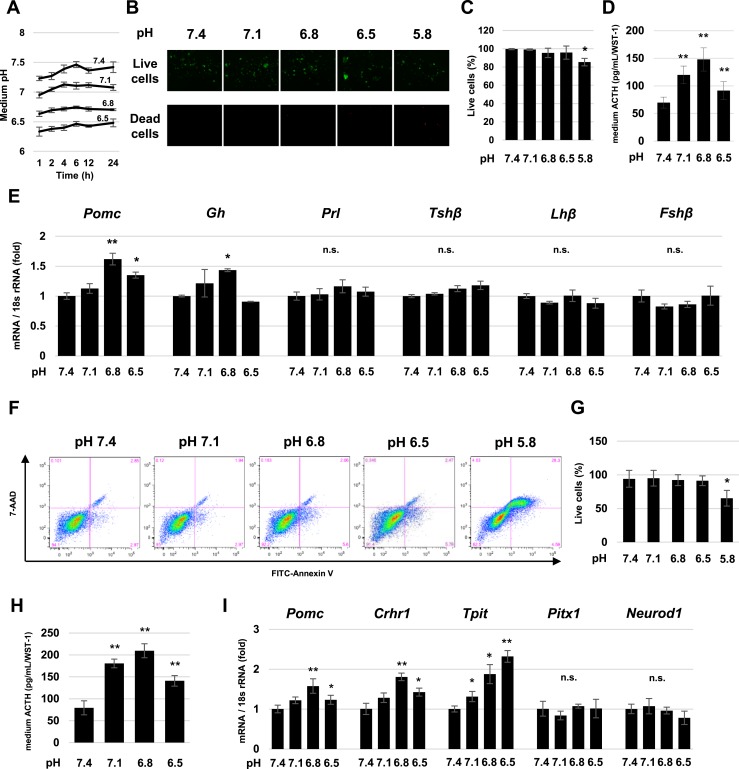
Proton sensitivity of mouse pituitary cells and AtT-20 cells. (A) Time course of pH changes in each pH-adjusted medium. (B) Cell viability of mouse pituitary cells after 24-h culture in pH 7.4, 7.1, 6.8, 6.5, and 5.8 medium. Green, live cells (upper panels); red, dead cells (lower panels). (C) Percentage of live cells in (A). For each pH, at least three randomly selected nonoverlapping vision fields were analyzed. (D) Measurement of ACTH levels in pH-adjusted culture medium of primary pituitary cells after 2-h treatment. (E) Quantitative RT-PCR analysis of Pomc, Gh, Prolactin (Prl), Tshβ, Lhβ, and Fshβ gene expression in primary mouse pituitary cells after 24-h treatment pH 7.4, 7.1, 6.8, and 6.5 medium. (F) Representative FITC-Annexin V vs 7-AAD dot plot of AtT-20 cells cultured in pH-adjusted medium for 24 h. (G) Percentages of live cells in (E). For each pH, three independent experiments were analyzed. (H) Measurement of ACTH levels in pH-adjusted culture medium of AtT-20 cells after 2 h of treatment. (I) Quantitative RT-PCR analysis of Pomc, Crhr1, Tpit, Pitx1, Neurod1, and Gh gene expression. Results are mean ± SD. *P < 0.05 vs pH 7.4; **P < 0.01 vs pH 7.4. n.s., not significant.

