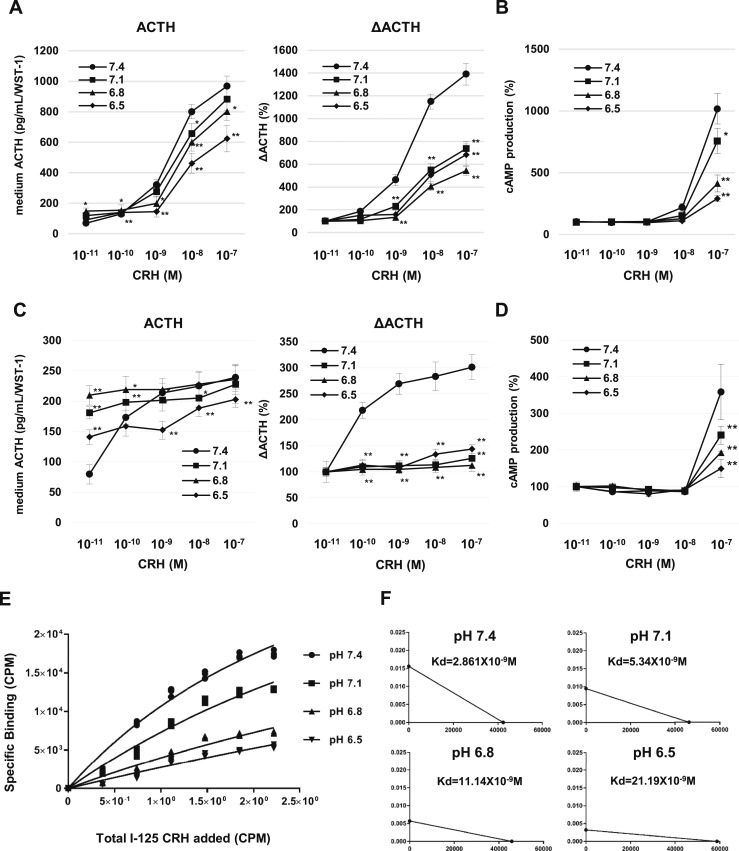
Figure 4.
CRH binding to CRHR1 in acidic pH. (A) Measurement of ACTH (left) and ΔACTH (right) in the culture medium of primary pituitary cells after 2-h treatment at pH 7.4, 7.1, 6.8, and 6.5 with increasing CRH concentrations. (B) cAMP levels in primary mouse pituitary cells treated in pH-adjusted medium with each respective CRH concentration for 30 min. Relative values were calculated separately for each group based on the value of the group treated with 0 M CRH. (C) Measurement of ACTH (left) and ΔACTH (right) in pH-adjusted culture medium of AtT-20 cells after 2-h treatment with each respective CRH concentration. (D) cAMP levels in AtT-20 cells treated in pH-adjusted medium with each respective CRH concentration. (E) Specific binding of I-125 CRH to CRHR1 in pH-adjusted binding buffers. (F) Scatchard plot analysis of binding assay. Each graph depicts the analysis of the corresponding results for each pH. Kd values are shown in each graph plot area. Results are mean ± SD. *P < 0.05 vs pH 7.4; **P < 0.01 vs pH 7.4.

