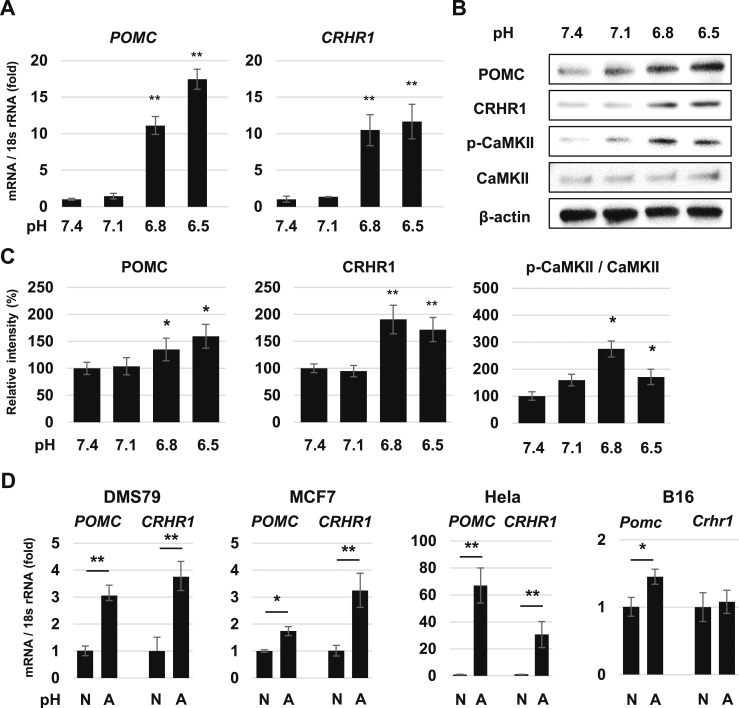
Figure 6.
Effects of acidic pH on POMC expression in nonpituitary cell lines. (A) Quantitative RT-PCR analysis of POMC and CRHR1 gene expression in COLO320 cells after 48 h of treatment in pH-adjusted medium. (B) Representative Western blots for POMC, CRHR1, p-CaMKII, CaMKII, and β-actin in COLO320 cells after 48-h treatment in pH-adjusted medium. (C) Quantification of each protein level in (B). (D) Quantitative RT-PCR analysis of POMC and CRHR1 gene expression in DMS79, MCF7, Hela, and B16 cells. Results are mean ± SD. *P < 0.05 vs pH 7.4; **P < 0.01 vs pH 7.4.

