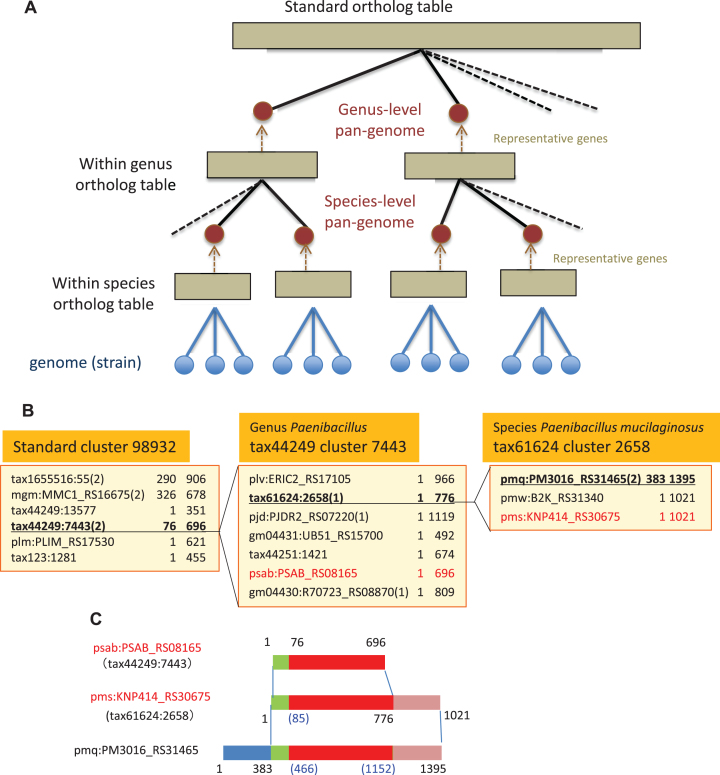
Figure 1.
The bottom-up procedure for constructing hierarchical orthology relationships. (A) Overview of the procedure. The procedure progresses from bottom to top. (B) Hierarchical ortholog groups. Here, the construction process goes from right to left and the expansion process goes from left to right. A representative gene in each cluster is indicated in red, and the target clusters to be expanded are underlined. A gene in a pan-genome is represented as ‘taxid:clustid’, which is actually the representative gene of the cluster. The number in parentheses is the domain number and the two numbers after each gene name are the beginning and end positions of the domain. (C) Domain boundary mapping between clusters at different levels. The example is the same as in B. The red segment corresponds to the domain tax44249:7443(2) in the standard cluster 98932. Missing positions by this mapping are filled by a simple linear interpolation, shown by the numbers in parentheses.

