Figure 3.
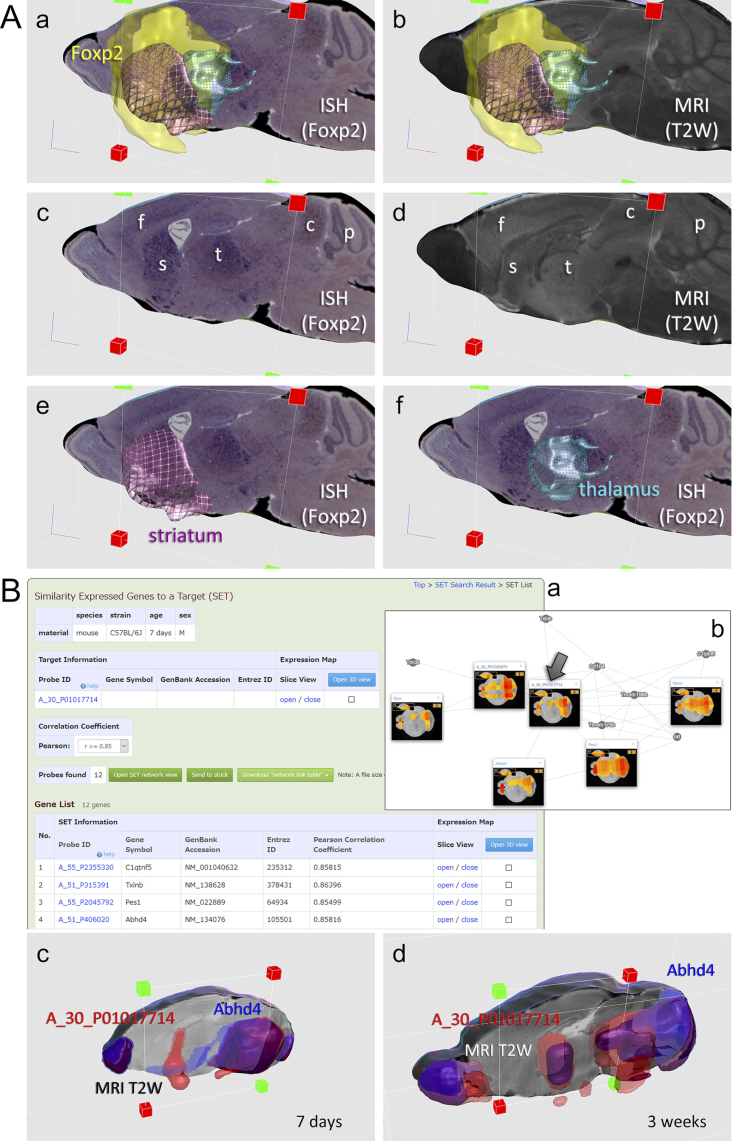
Example results in anatomical BAH viewer and topological network viewer. (A) Foxp2 is a gene for a transcription factor, which functions in brain development. In the BAH viewer at 8 weeks post-natal stage, (a) Foxp2 3D expression map (yellow) and the ISH image on the best-fit slice of the MR image are shown along with anatomical area maps of the striatum (purple) and the thalamus (light blue), (b) the 3D map and the anatomical area maps are shown in the same slice of the MR image, (c) and (d) the ISH image and the MR image comparable in the same section, and (e) and (f) the ISH image and the anatomical map. These images show that Foxp2 gene is still expressed in the 8-weeks matured brain, mostly in the forebrain, including the frontal cortex (f), the striatum (s) and the thalamus (t), and, in some mounts, presents in the colliculus and the Purkinje cell layers (the scene-setting parameter: https://vibrism.neuroinf.jp/setsearch/3d/view/Cx1/4ae7e07297a029ce7229f1808d32f8ca). (B) A_30_P01017714 is a lncRNA of unknown function. (a) SET search results at 7 days of post-natal stage are shown: 12 genes are present in the SET and several are shown. Buttons for open SET network graph, data stock, link table download, and open 3D view are shown. (b) An example of stochastic network graphs of SET of this gene (with an arrow) at 7 day post-natal stage. 2D thumbnails are shown. After data stock, calculating intersection of SET at 3 day, 7 day and 3 week stages in the platform, A_30_P01017714 is found to be co-expressed with Abhd4 at 7 days and 3 weeks. (c) and (d) Areas of co-expression are shown in the 3D viewer (the scene-setting parameter: at the 7-day stage: https://vibrism.neuroinf.jp/setsearch/3d/view/Cf0/27a5e2195222b578194ca22f15db1d5b and at the 3-week stage: https://vibrism.neuroinf.jp/setsearch/3d/view/Cg0/496aed8e85ed1bfee8eb62b2cd1d416b).

