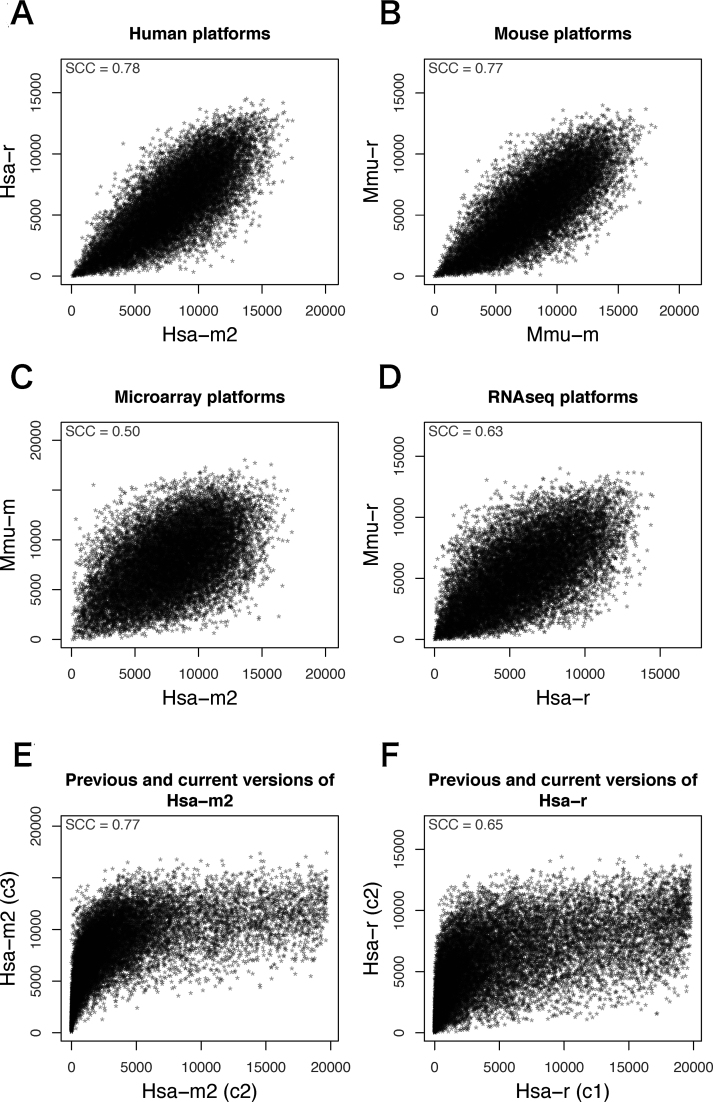
Figure 2.
Comparison of MR values in the four platforms in human and mouse. MR index values in different platforms/versions have been plotted, where smaller value indicates stronger coexpression. Intraspecies difference (A, B) is smaller than interspecies difference (C, D). Difference between RNAseq platforms is smaller than that between microarray platforms (C, D). Distribution of MR values in the current version are different from that of the previous version (E, F). The details of the coexpression platforms are shown in Table 1. SCC; Spearman's rank correlation coefficient.

