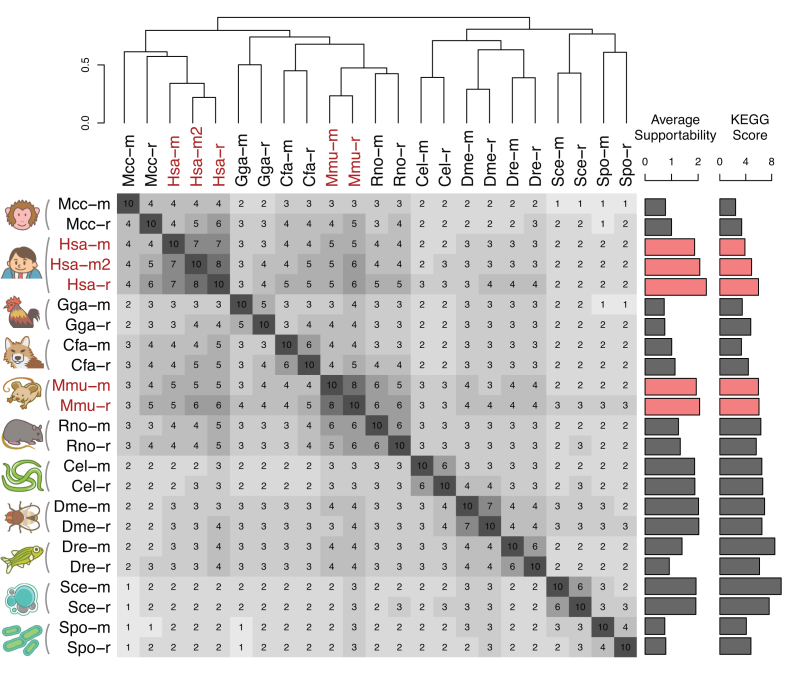
Figure 3.
Similarity among the current coexpression data in COXPRESdb. Coexpression similarity was calculated using Spearman correlation coefficient for the coexpression values for 16 110 gene pairs among the 180 one-to-one orthologous gene groups. The 180 orthologous genes have expression values for all the 23 platforms provided in COXPRESdb. For visualization of the correlation matrix, 10-fold values of the Spearman's rank correlation are displayed. The correlation matrix was hierarchically clustered by the complete linkage method for correlation distance (1 – correlation). KEGG scores in Figure 1 and average supportability calculated from Figure 4 are also presented as bar plot. Platforms for human and mouse are highlighted, which show high reproducibility.

