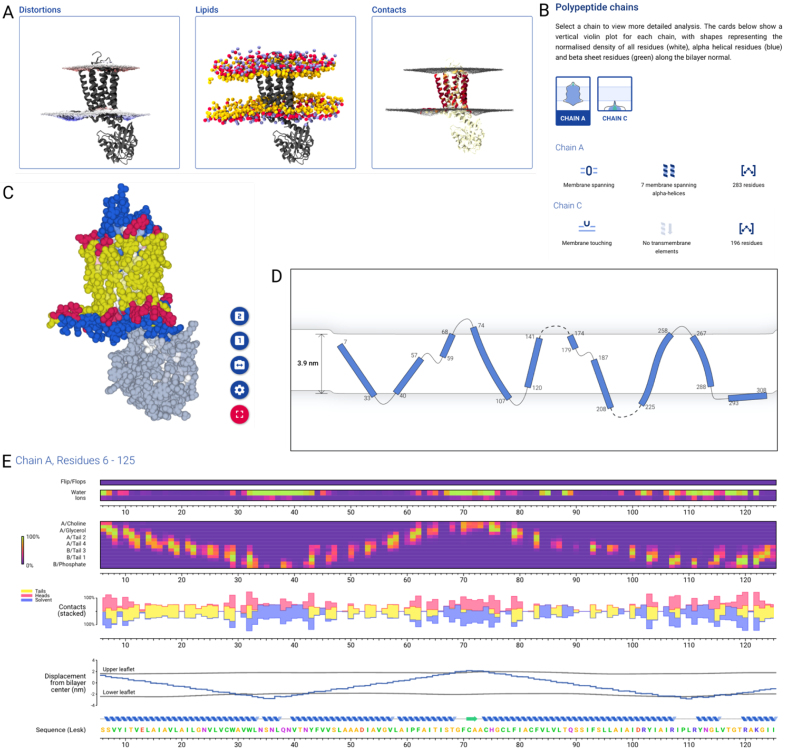
Figure 3.
Online analysis and visualization of a simulation of the A2A adenosine receptor. (A) Pre-rendered images available to view and download showing (from left to right) protein with membrane surface shaded to show thinning (red) and thickening (blue), protein with CG lipid head-group beads (yellow: glycerol, red: phosphate, blue: choline) and protein surface shaded according to contacts with lipid head-groups. (B) Chain-by-chain overview of the protein, showing violin plot of protein density along membrane normal, classification of chain membrane interactions (‘Membrane spanning’), topology summary (‘7 membrane spanning α helices’) and residue count. (C) Online 3D protein view showing protein in sphere representation coloured by membrane contact type (yellow: acyl tails, red: lipid head-groups, blue: solvent). The selected chain (Chain A) is shown in full colour, whilst other parts of the protein are desaturated. (D) Topology viewer showing tilt and curvature of TM helices. Non-continuous loops are shown as dashed lines. The membrane thickness and degree of protein-induced deformation is shown. (E) Sequence viewer showing several metrics along the amino acid sequence: (from top to bottom) contacts with lipids flipping from one leaflet to another; contacts with water and ions; contacts with lipids, broken down by chemical group; stacked plot of contacts with acyl tails, head-groups and solvent; position of the protein and local membrane thickness; protein secondary structure and amino acid sequence.

