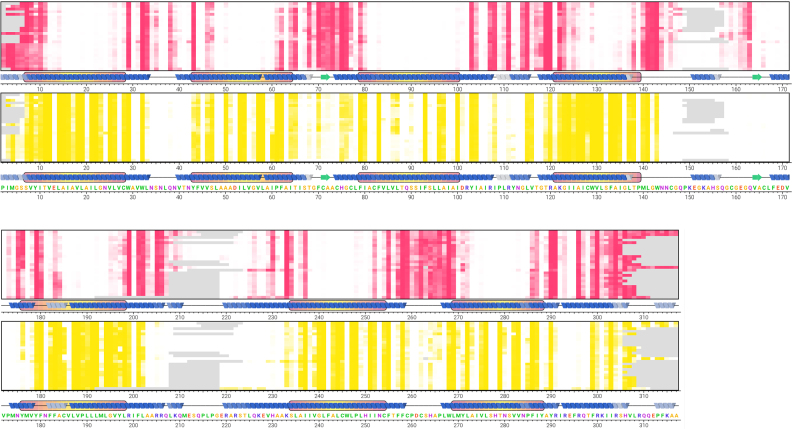
Figure 4.
Online sequence view for 25 simulations of the UniProt AA2AR_HUMAN entry (Uniprot id: P29274) contacts with lipid head-groups (red) and lipid acyl tails (yellow) are shown arranged along the protein amino acid sequence, with each row representing a single simulated structure. A consensus secondary structure is shown at the bottom of each row for each PDB file, shaded darker where secondary structure is more highly conserved within the structures. TM domains are shown by a box around the secondary structure, shaded according to mean depth within the membrane, from red (shallow) to yellow (deep), where a certain residue was not present in a structure the cell is shaded grey.

