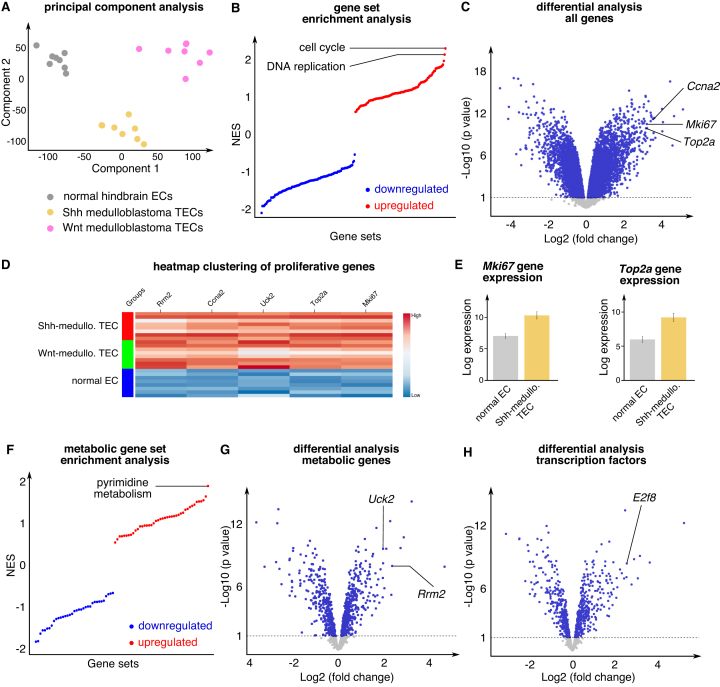
Figure 3.
Study-centered data exploration. (A) PCA of normal hindbrain, Shh-medulloblastoma and Wnt-medulloblastoma ECs (study E-GEOD-73753). (B) Gene set enrichment analysis of normal hindbrain ECs versus Shh-medulloblastoma ECs. The upregulated gene sets are shown in red, the downregulated gene sets are shown in blue. (C) Differential analysis of normal hindbrain ECs versus Shh-medulloblastoma ECs shown in volcano plot; some highly deregulated proliferation-associated genes are indicated. (D) Gene expression heatmap of normal hindbrain ECs versus Shh-medulloblastoma and Wnt-medulloblastoma. The high-gene expression levels are shown in red, the low-expression levels in blue. (E) Expression of the indicated genes in normal hindbrain ECs and Shh-medulloblastoma ECs. (F) Metabolic gene set enrichment analysis of normal hindbrain ECs versus Shh-medulloblastoma ECs. The upregulated gene sets are shown in red, the downregulated gene sets are shown in blue. (G and H) Differential analysis of normal hindbrain ECs versus Shh-medulloblastoma ECs for the subset of metabolic genes (G) and transcription factors (H) shown as a volcano plot. Abbreviations—Ccna2: cyclin A2; Mki67: marker of proliferation ki67; NES: normalized enrichment score; Rrm2: ribonucleotide reductase regulatory subunit M2; Shh: Sonic Hedgehog; TEC: tumor endothelial cell; Top2a: topoisomerase 2 alpha; Uck2: uridine-cytidine kinase 2.

