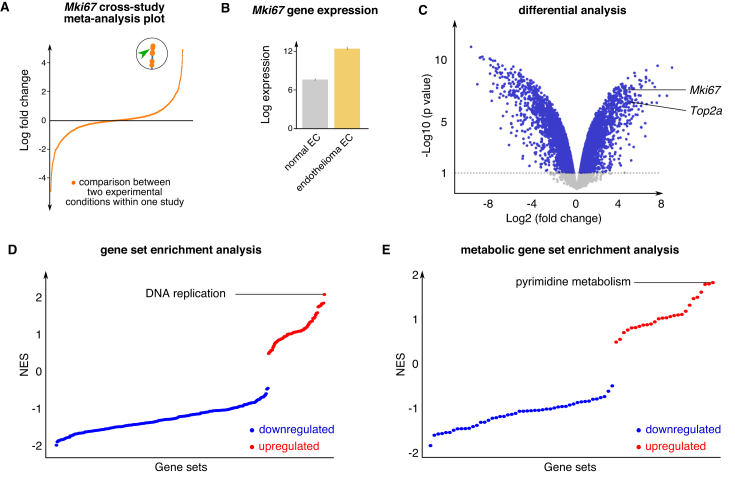
Figure 4.
Gene and pathway-centered data exploration, example of Mki67 gene search. (A) Dot plot showing log fold change of Mki67 gene expression in all sample comparisons in EndoDB datasets. The dot indicated by the green arrow head in the enlarged circle represents the pair-wise comparison selected for further analysis (data from study E-GEOD-14375). (B) Expression of the Mki67 gene in normal hindbrain ECs and endothelioma ECs. (C) Differential analysis of normal brain ECs versus endothelioma ECs for all genes shown in volcano plot. Mki67 and Top2a genes are indicated. (D and E) Gene set enrichment analysis of normal brain ECs versus endothelioma ECs for all genes (D) and for the subset of detected metabolic genes (E). The upregulated gene sets are shown in red, the downregulated gene sets are shown in blue. Abbreviations—Mki67: marker of proliferation ki67; NES: normalized enrichment score; Top2a: topoisomerase 2 alpha.

