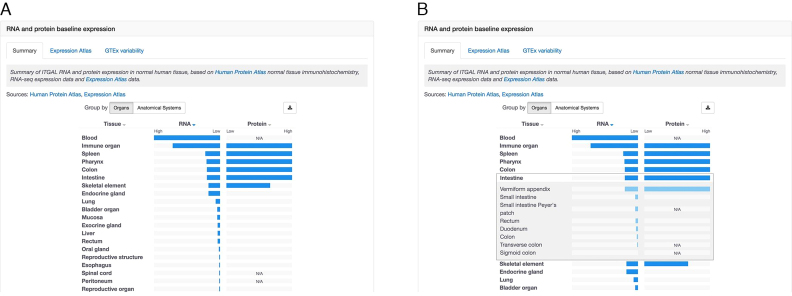
Figure 3.
RNA and protein expression data are displayed side by side for easy comparison of target expression levels in healthy human tissues. (A) Each horizontal bar representing a tissue, e.g. Intestine, can be expanded to provide a detailed breakdown of expression in different parts of the tissue/organ, such as ‘Vermiform appendix’ and ‘Duodenum’ (B).

