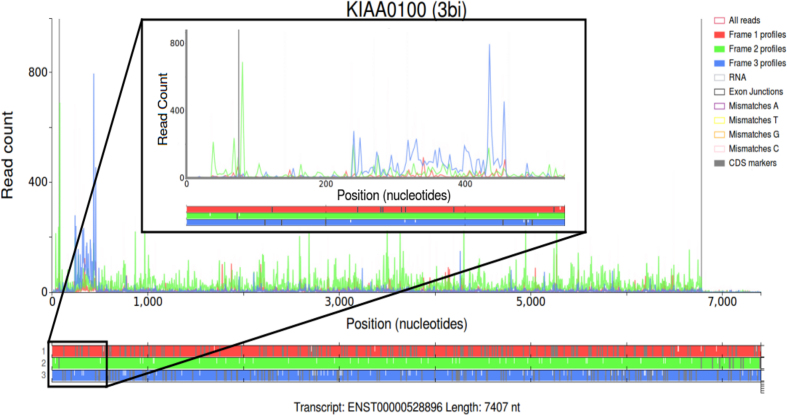
Figure 1.
Modified screenshots of the Trips-Viz single transcript plots for a Gencode transcript of the human KIAA0100 gene (large plot) and its 5′ area (small plot). Ribo-Seq read densities are displayed in the main window, color coded according to their mapping phase relative to the reading frame subcodon positions. Transcript coordinates are shown on the x-axis, while read counts are shown on the y-axis. The ORF architecture is shown below with three different reading frames differentially colored, stop codons indicated as vertical grey dashes and AUGs as white dashes.

