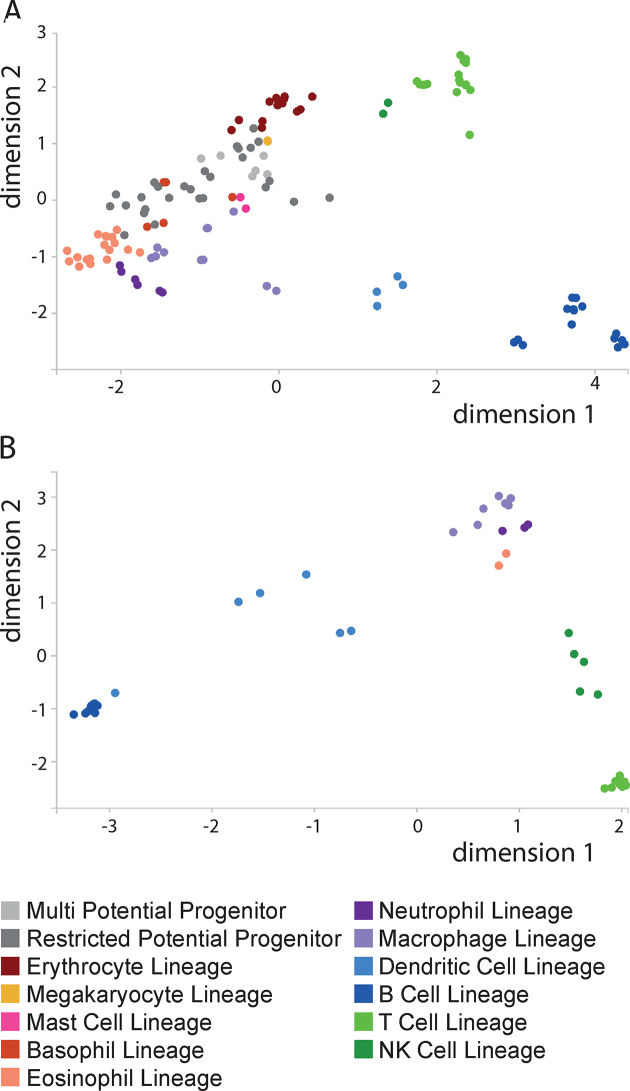
Figure 1.
Multi-dimensional scaling plot. Multi-dimensional scaling (MDS) plots of the (A) Haemopedia mouse RNA-seq and (B) Haemopedia human RNA-seq data sets. Plots were produced by Haemosphere, using the Euclidean distance between the 500 most variable genes in each data set, with the dimension reduction performed with principal coordinates analysis. Each dot represents a sample and they are coloured by lineage as shown in the key.

