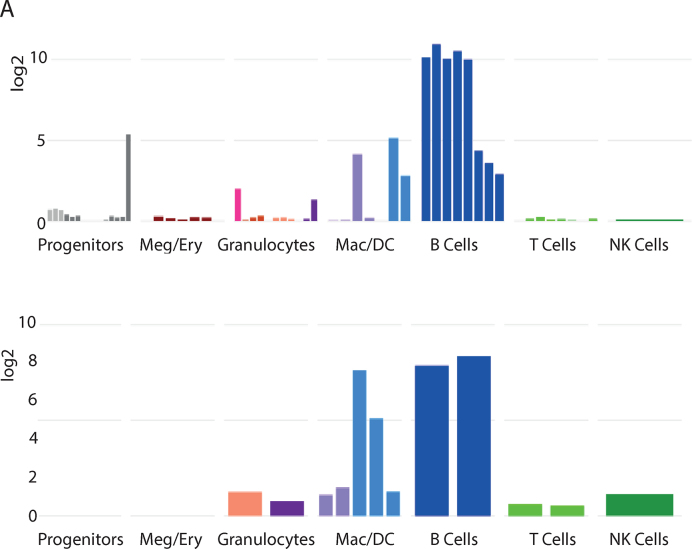
Figure 2.
Multi-species plot. Example multi-species graphs from Haemosphere comparing Cd19 expression in the Haemopedia mouse RNA-seq data set to its orthologue CD19 in the Haemopedia human RNA-seq data set. Cell types have been assigned to lineages, and plotted with shared colours according to the colour scheme in Figure 1. Some related lineages, such as granulocytes, have been grouped together to simplify the view. On the website, hovering over each bar reveals the cell type name and clicking on the data set name takes the user to the gene's expression plot in that data set to display more detail.

