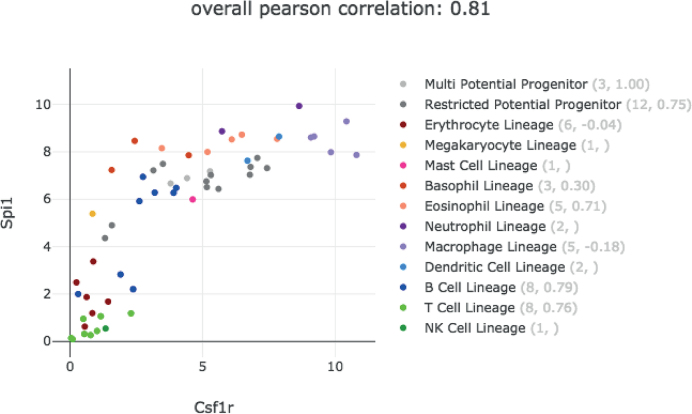
Figure 3.
Gene versus gene plot. Example of gene versus gene plot from Haemosphere using the Haemopedia mouse RNA-seq data set. The expression of the transcription factor Spi1 is plotted against Csf1r expression. Each dot represents average expression for a different cell type and is coloured according to lineage. The number of cell types in a lineage and the Pearson correlation within the lineage is shown in brackets in the legend.

