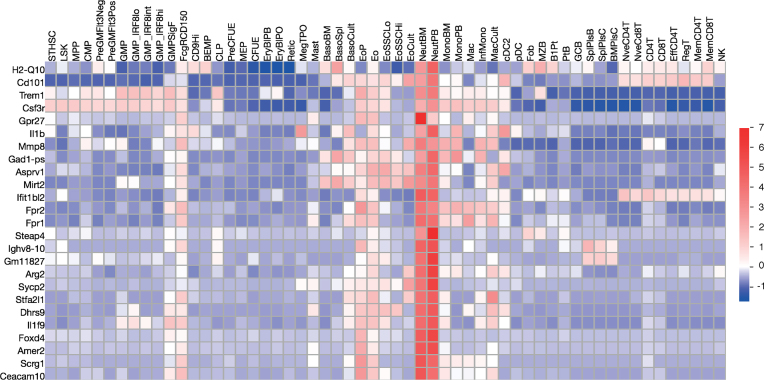
Figure 4.
Heatmap of genes with high expression in neutrophils. This heatmap was generated from haemosphere.org using the Haemopedia mouse RNA-seq data set and shows the 25 most enriched genes in the neutrophil lineage as selected by Haemosphere's ‘High Expression Search’ function. Squares are coloured by row based z score.

