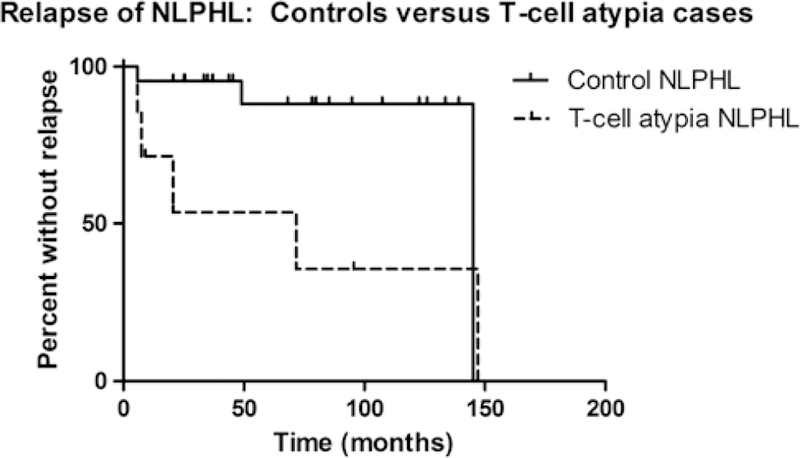
FIGURE 1.
Kaplan-Meier analysis of time to first relapse following the initial diagnosis of NLPHL. Patients with morphologically atypical T cells had a shorter time to relapse compared with control patients lacking morphologically atypical T cells (P = 0.04). Broken line indicates NLPHL patients with morphologically atypical T cells and solid line indicates control patients. Vertical lines represent censored patients.

