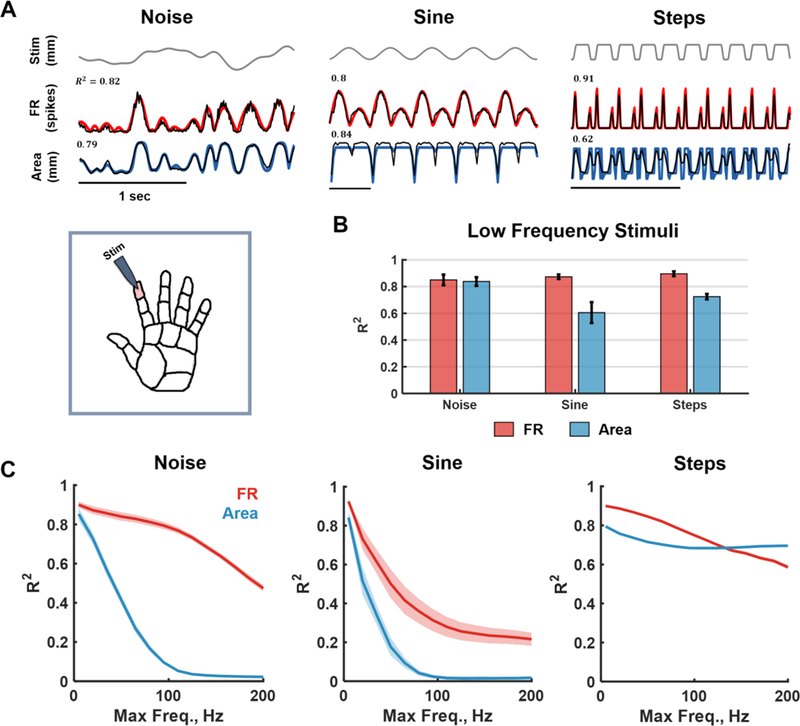
Figure caption 2. Model validation with parametric stimuli.

A| Inset: The index finger pad was stimulated with a set of tactile stimuli – noise, sinusoids and sustained indentations (steps). Main: Examples of model fits. Top: Time-varying stimulus trace. Middle: Population firing rate (FRt) computed using the full afferent model (TouchSim, black) and using the simplified biomimetic model (red). Bottom: Time varying area of activation computed using TouchSim (black) and using the biomimetic model (blue). R2 denotes the match between TouchSim and the simple model predictions for that trace. B| Mean goodness-of-fit for the firing rate and area models trained to reconstruct low-frequency stimuli (up to 10Hz). The test sample consisted of noise filtered below 10Hz (different seed), steps (of random amplitudes and durations), and sinusoids (from 1 to 10 Hz). The simple model captures most of the variance in both the aggregate firing rate and activated area over this range of frequencies. C|Mean goodness-of-fit of firing rate (red) and area (blue) predictions as a function of the low-pass cut-off frequency of the stimuli for noise, sinusoids, and steps. Forty models were trained with varying cut-off frequencies (5Hz-200Hz) and tested on sinusoids and noise (comprising components with frequencies at or below the training cut-off) and steps of random amplitudes and duration. At high frequencies, the aggregate response becomes tonic rather than oscillatory so performance plummets for sinusoids and noise (see detailed fits in Supplementary Figure 2).
