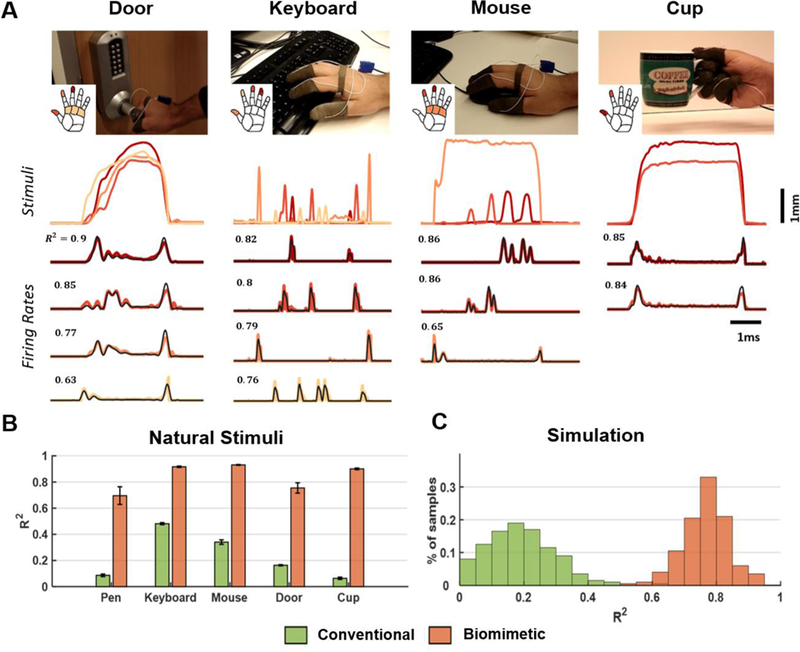
Figure caption 3. Model validation with simulated natural stimuli.

A| Sample traces from pressure sensors on the fingertips and the palm along with the firing rate (FRt) estimated using TouchSim or the biomimetic model for four activities of daily living: opening a door, typing on a keyboard, using a mouse, and picking up a cup. Top: Each trace denotes the stimulus, color coded by location (see inset). Bottom traces: population firing rate (black) vs. predicted firing rate computed for each task and each projection field (same color as the corresponding stimulus). R2 denotes match between TouchSim and simple model predictions for that trace. B| Model performance, averaged across all sessions and hand locations with significant sensor output. The green and orange bars denote the performance of the conventional and biomimetic encoding models, respectively. Error bars show standard errors in each sample. C| Performance of the two models for simulated tactile stimuli mimicking natural stimuli (n=200).
