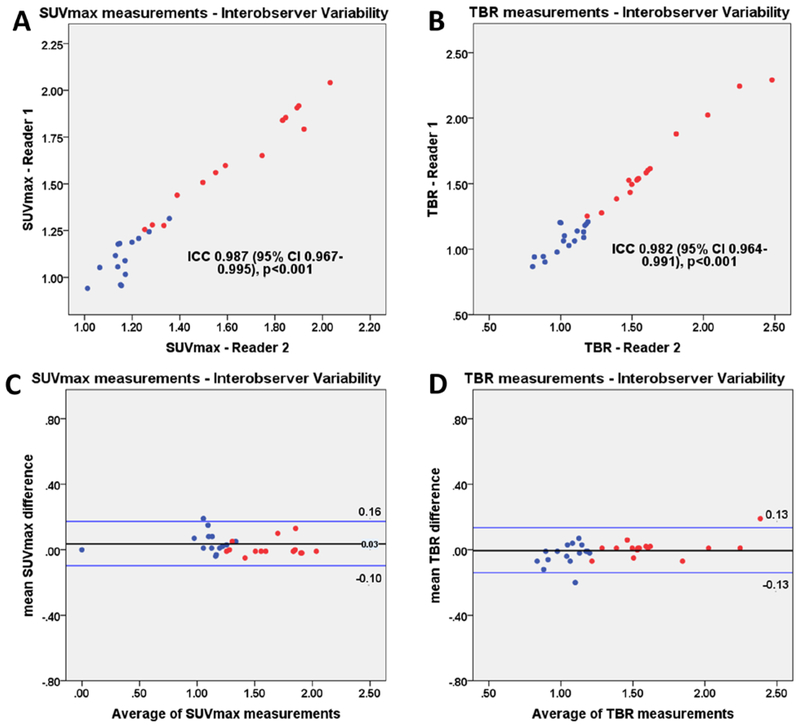
Figure 3. Interobserver variability of uptake measurements on prior CTA (PET/CTA1).
Scatter plots and Bland Altman plots of prior CTA (PET/CTA1) SUVmax (a, c) and TBR (b, d) measurements of lesion with (red) and without (blue) increased tracer uptake. SUVmax= maximal standard uptake, TBR = target to background ratio.

