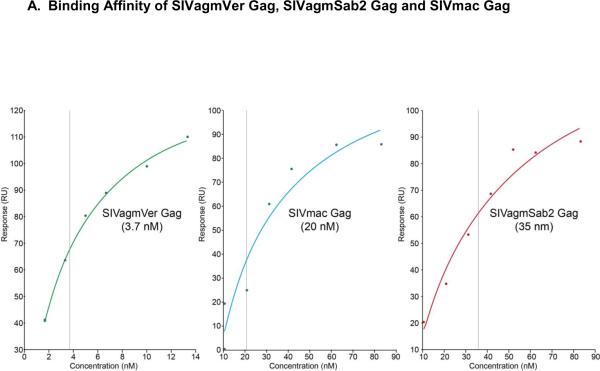
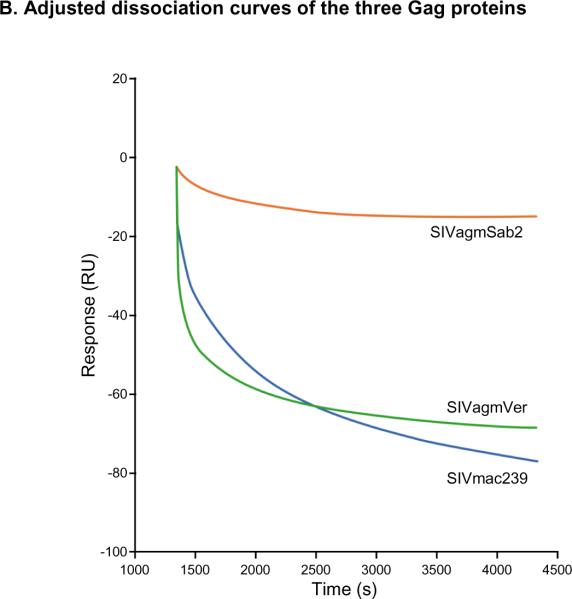
Figure 5. Surface plasmon resonance (SPR) analysis.
A: Binding affinity profiles of Gag proteins derived from different SIVs to AG3.0 measured by BIAcore as described in the materials and methods. Sensor chips coated in AG3.0 were exposed to purified preparations of the different Gag proteins at various concentrations. Binding was measured as a change in RU at equilibrium. The apparent kD values were determined using the BiaEvaluation software (GE Healthcare). B: Dissociation curves for the different Gag proteins (1.5 μg/ml) using an injection period of 1,080 sec, a dissociation time of 3,000 sec, and a flow rate of 5 μl/min.


