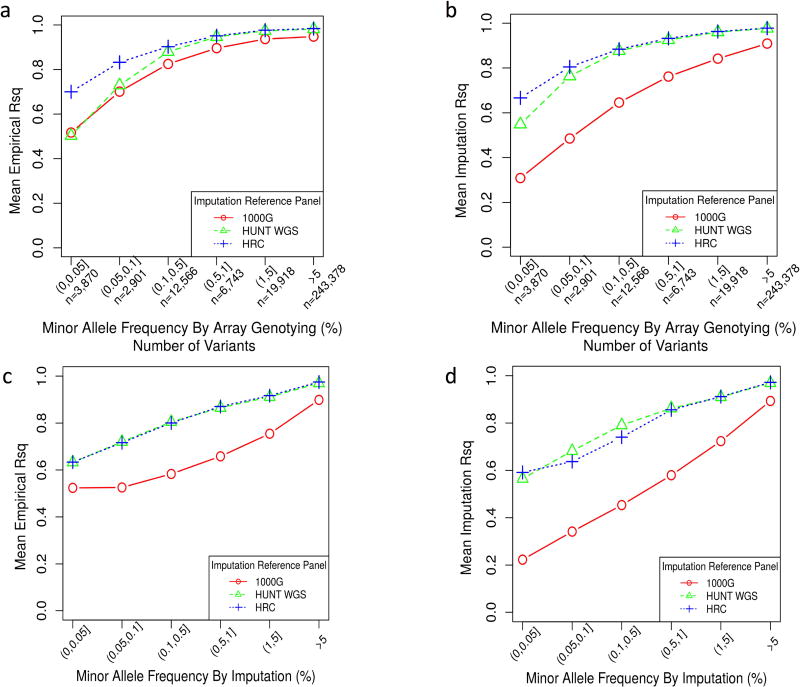
Figure 3. HRC and HUNT WGS panels show comparable imputation quality.
a. comparing the mean empirical R2 (y axis) reported by different reference panels for variants that are directly genotyped categorized by the MAF (x axis) without any ImpRsq threshold applied.
b. comparing the mean Imputation R2 (y axis) reported by different reference panels for variants that are directly genotyped categorized by the MAF (x axis) without any ImpRsq threshold applied.
c. comparing the mean Imputation R2 (y axis) reported by different reference panels for all imputed variants (ImpRsq > 0.3) by the MAF (x axis).
d. comparing the mean Imputation R2 (y axis) reported by different reference panels for all imputed variants by the MAF (x axis) without any ImpRsq threshold applied.
1000G, 1000 Genomes Phase 3; WGS, whole-genome sequencing; HRC, Haplotype Reference Consortium; MAF, minor allele frequency; ImpRsq, imputation quality metric R2

