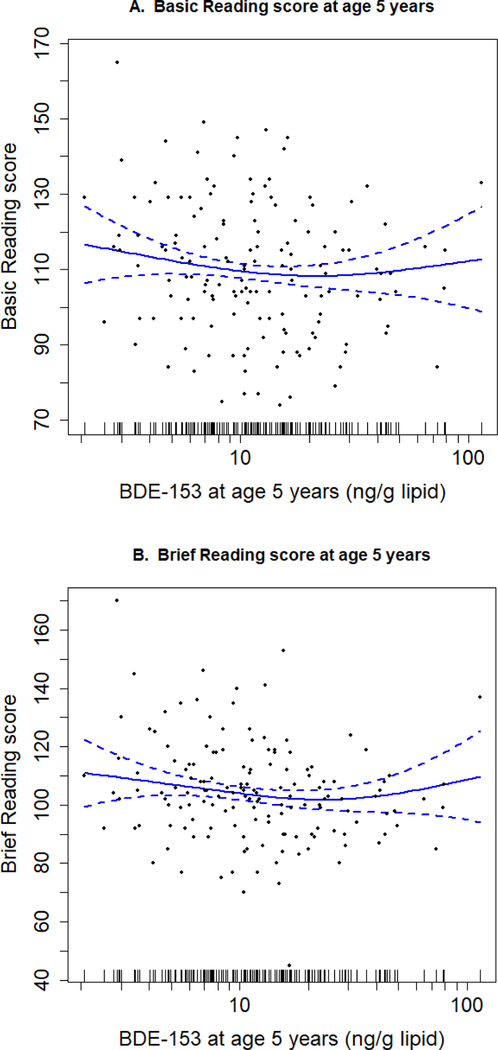
Figure 2.
Scatter plots of childhood serum BDE-153 concentrations and WJ-III reading scores at age 5 years with Generalized Additive Model curve fitting using the non-imputed, original dataset. (A.) Basic Reading score at 5 years (n=153); (B.) Brief Reading score at 5 years (n=154). Data points represent serum BDE-153 concentrations at age 5 years and corresponding reading score for each child. Solid lines indicate the natural cubic spline regression of the association after adjustment for maternal age, education, race, IQ, household income, parity, marital status, maternal serum cotinine, maternal depression, child sex, and HOME score. Dotted lines are 95% confidence intervals of the regression curve.

