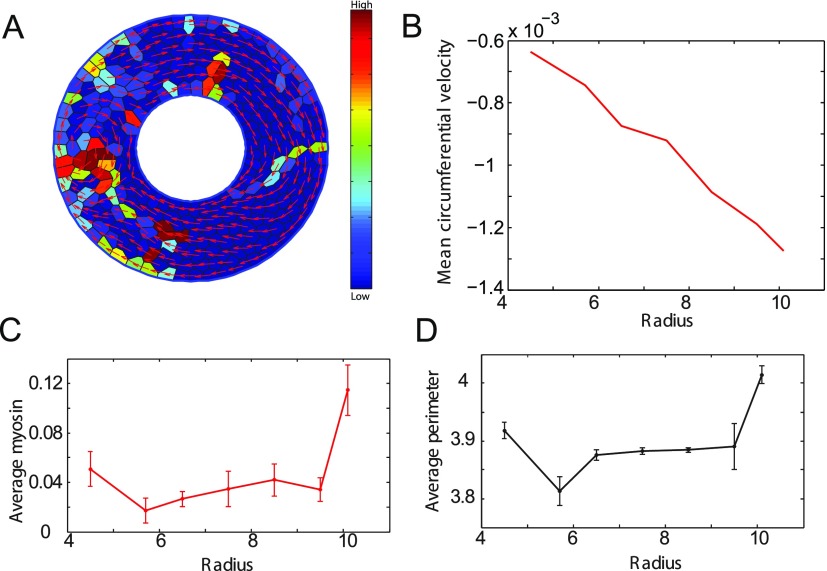
FIG. 8.
Vortex formation and myosin distribution in cells on ring substrates. (A) Figure showing rotation with vortices on a ring using model with signaling. Velocity vectors are shown in red. The cell colors represent activated myosin content, blue to red showing low to high values. (B) Plot showing the average circumferential velocity as a function of time. Red circles indicate the mean velocity at the inner boundary, and blue circles indicate the mean velocity at the outer boundary. The mean velocity at the inner boundary shows positive jumps showing clock wise rotation when the velocity at the outer boundary is in the counter clockwise direction. This is indicative of vortex formation as seen in the vortex in (A) where the cells at the inner ring are moving in a direction opposite to the cells at the outer ring. (C) Plot showing the average myosin content as a function of ring radius. Higher myosin content in the outer ring cells when compared to the inner ring cells. This trend is also reflected in the plot (D) showing average perimeter as a function of radius.

