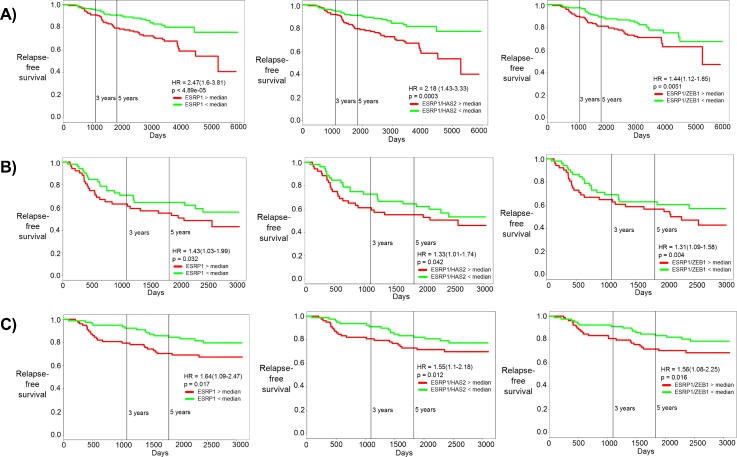
FIG. 5.
Correlation of ESRP1, ESRP1/HAS2, and ESRP1/ZEB1 with patient prognosis. Kaplan-Meier curves for relapse-free survival for (a) GSE 17705, (b) GSE 42568, and (c) GSE 1456. HR stands for the hazard ratio, i.e., the ratio of likelihood of relapse-free survival of patients with low ESRP1 as compared with those with high ESRP1. The first column is for ESRP1, the middle column is for the ESRP1/HAS2 ratio, and the right column is for the ESRP1/ZEB1 ratio. The red curve shows patients with high ESRP1 levels and green curves patients with low ESRP1 levels (separated by median).

