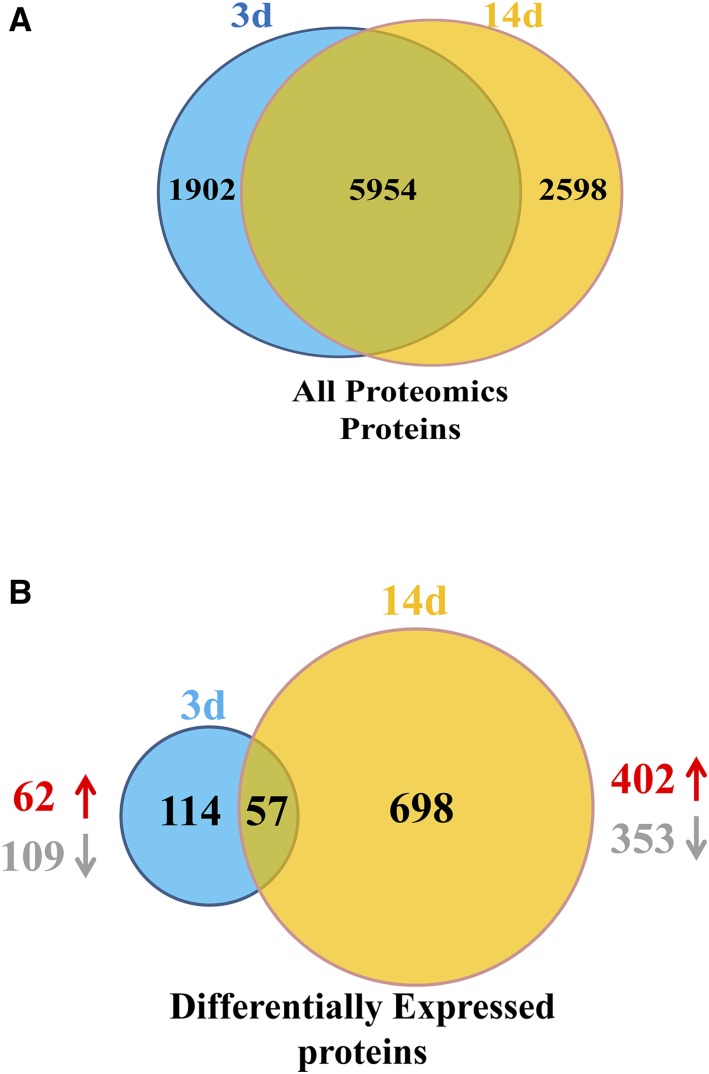
Figure 3.
Patterns of proteins and differentially expressed proteins (DEPs) identified in rapeseed roots after implementing the 3-d and 14-d low-N treatment. A, All proteomics proteins. B, DEPs. Venn diagrams show the number of total proteins identified at 3 d (blue) and 14 d (yellow), with the proteins in common to both sampling times in the overlapping sections. Proteins were identified by TMT-based measurements from three biological replicates of rapeseed roots. DEPs were the proteins expressed at different levels in low-N compared with high-N conditions on the same sample day. Up and down arrows represent up-regulated and down-regulated proteins, respectively.

