Figure 1.
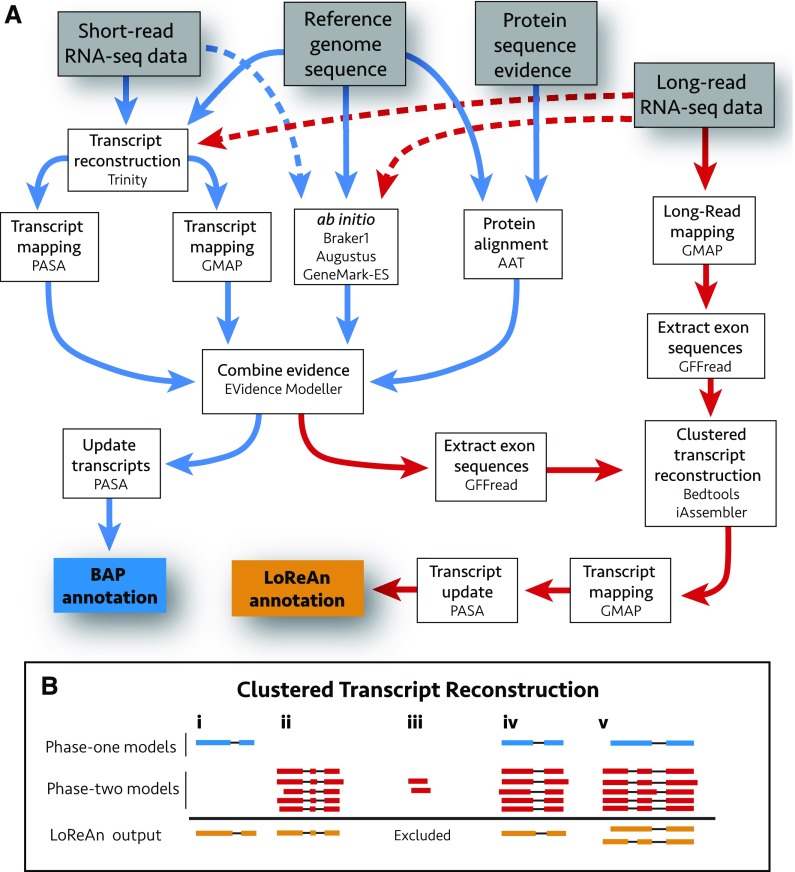
Schematic overview of the LoReAn pipeline and clustered transcript reconstruction. A, Illustration of the computational workflow for the LoReAn pipeline. Gray boxes represent input data, and each white box represents a step in the annotation process with mention of the specific software. The boxes connected by blue arrows integrate the steps from the previously described BAP, described in the text as phase one of LoReAn (Haas et al., 2008). The LoReAn pipeline (boxes connected by red arrows) integrates the BAP workflow but additionally incorporates long-read sequencing data, described in the text as phase two of LoReAn. The blue box, “BAP annotation,” represents the annotation results from the BAP pipeline used for comparison in this study, while the orange box “LoReAn annotation” represents the annotation results from the LoReAn pipeline using long-read sequencing data. Dashed arrows represent optional steps for the pipeline. B, Illustration of the clustered transcript reconstruction. Gene models are depicted as exons (boxes) and connecting introns (lines). Blue models represent BAP annotations, while red models represent hypothetical long reads mapped to the genome. Orange models represent consensus annotations reported in the final LoReAn output. Various scenarios can occur: (i) High-confidence predictions from the BAP are kept regardless of whether they are supported by long reads. (ii and iii) Clusters of mapped long reads are used to generate a consensus prediction model, unless the model is supported by less than a user-defined minimum depth. (iv) Overlapping BAP and mapped long reads are combined to a consensus model. (v) Two annotations are reported if no consensus can be reached for the BAP and clustered long-read data.

