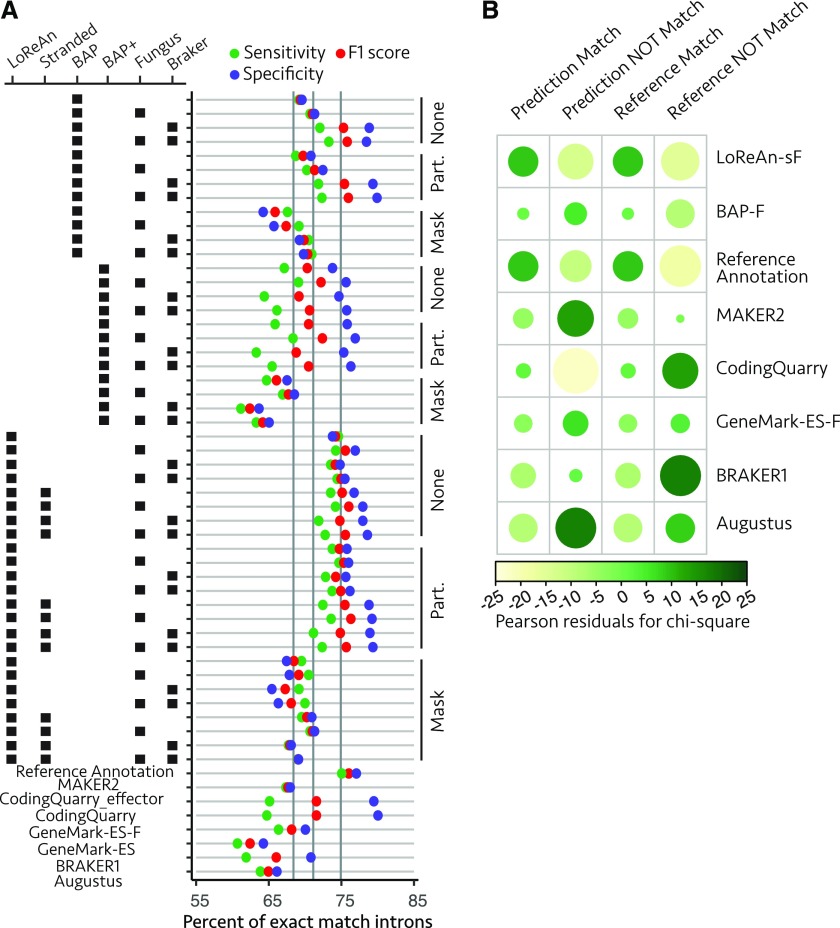
Figure 4.
Annotation quality summary for predicted introns exactly matching RNA-seq-inferred introns. A, Predicted intron quality summary, where each horizontal bar represents an annotation output, and each colored dot represents the sensitivity (green), specificity (purple), and F1 score (red) as described in Figure 2A. B, The proportion of exact match to nonmatching intron predictions (specificity) and exact match to missing intron predictions (sensitivity) were compared using a χ2 test of independence as described in Figure 2B. GeneMark-ES-F, GeneMark gene prediction software using the "fungus" option. LoReAn-sF, LoReAn using strand information and the "fungus" option of GeneMark-ES.

