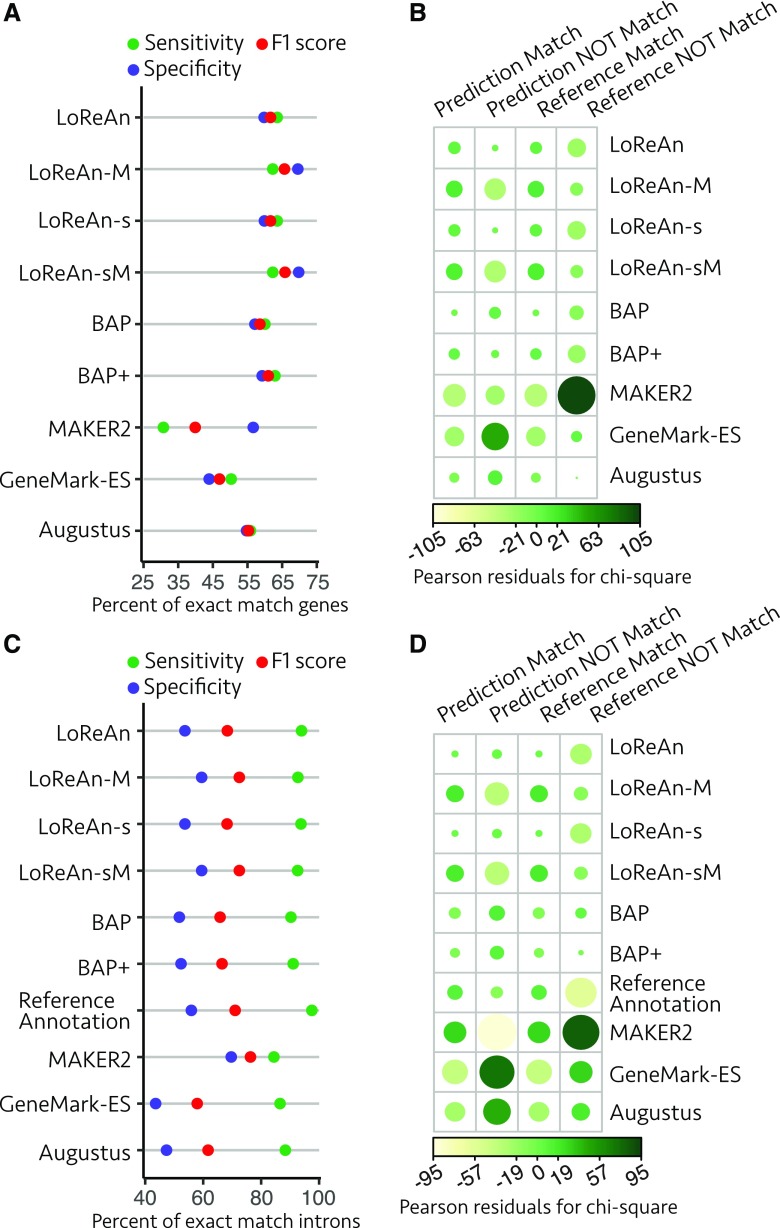
Figure 7.
Assessment of gene and intron predictions from Arabidopsis. A, Annotation quality metrics are shown for exact-match genes as detailed for Figure 2A. LoReAn, LoReAn in nonstranded mode using a nonmasked genome; LoReAn-M, LoReAn in nonstranded mode using a masked genome; LoReAn-s, LoReAn in stranded mode using a nonmasked genome; LoReAn-sM, LoReAn in stranded mode using a masked genome; BAP, broad annotation pipeline; BAP+, broad annotation pipeline plus additional modifications described in text. B, The proportion of exact match to nonmatching gene predictions (specificity) and exact match to missing gene predictions (sensitivity) compared using a χ2 test of independence as described in Figure 2B. C and D are for exact match intron analysis, represented as in A and B, respectively.

