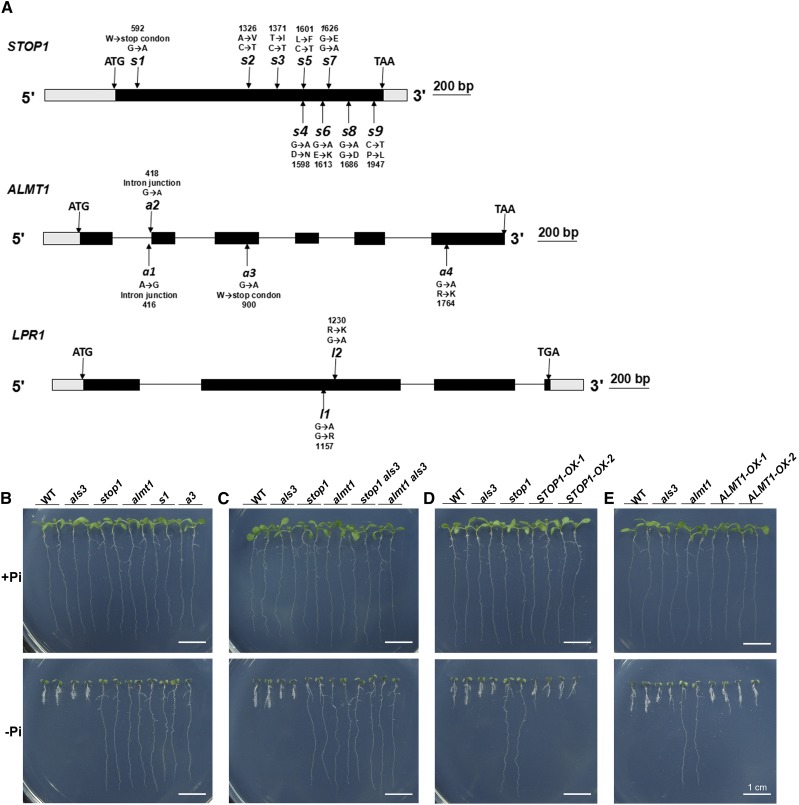
Figure 1.
Molecular lesions and growth phenotypes of the genetic suppressors of als3. A, Diagrams showing the structure of the STOP1, ALMT1, and LPR1 genes and the positions of the mutations (arrows) in als3 suppressors. Black boxes, gray boxes, and horizontal lines represent the coding regions, untranslated regions, and introns, respectively. B to E, Morphologies of 6-d-old seedlings of the wild type (WT), various mutants, and als3 suppressors grown on +Pi and −Pi media. B, The wild type, als3, stop1, almt1, s1, and a3. C, The wild type, als3, stop1 als3, and almt1 als3. D, The wild type, als3, stop1, and two STOP1-OX lines. E, The wild type, als3, almt1, and two ALMT1-OX lines. Bars = 1 cm.

