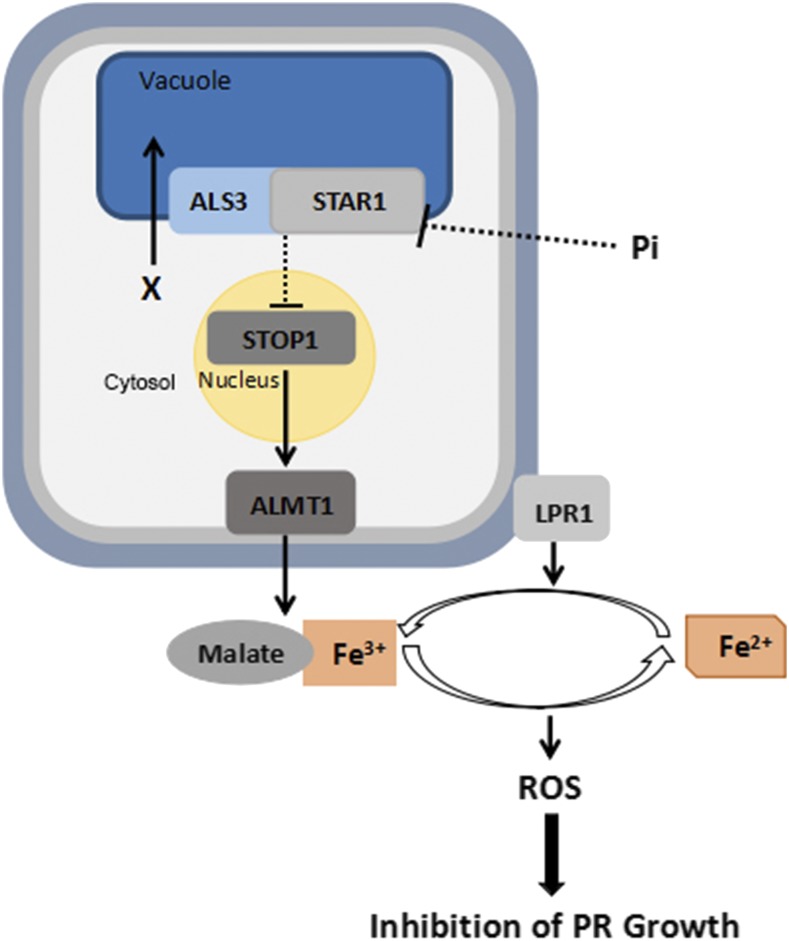
Figure 10.
Working model showing ALS3/STAR1, STOP1, ALMT1, and LPR1 interactions to regulate PR growth under Pi deficiency. Arrows indicate promotion, and perpendicular lines indicate suppression. Dotted lines indicate indirect interactions. X, An unidentified metabolite or ion; gray line surrounding the cell, the plasma membrane; light blue line surrounding the cell, the cell wall.

