Figure 3.
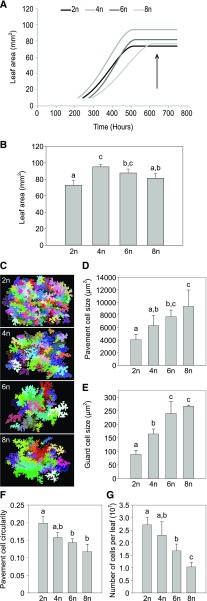
Cellular analysis of polyploid Arabidopsis. A, Leaf area of the first two leaves (L1/2) over time in polyploid Arabidopsis (2n, diploid; 4n, tetraploid; 6n, hexaploid; 8n, octaploid). The arrow indicates the time point where L1/2 were harvested for further analysis. B, Leaf area of L1/2 on day 31, which was chosen as the time point to make cellular drawings of abaxial epidermal cells. C, Representative cellular drawings of abaxial epidermal cells of polyploid plants. D, Average size of abaxial epidermis cells of L1/2 leaves of polyploid plants. E, Average size of stomatal guard cells of polyploid plants. F, Average circularity of abaxial epidermis cells of L1/2 leaves of polyloid plants. G, Average number of cells per L1/2 of polyploid plants. Error bars represent SD; Different lowercase letters indicate statistically significant difference; n = 8 plants per time point; Statistical analysis was done with univariate analysis and Scheffe posthoc testing in SPSS; α = 0.05.

