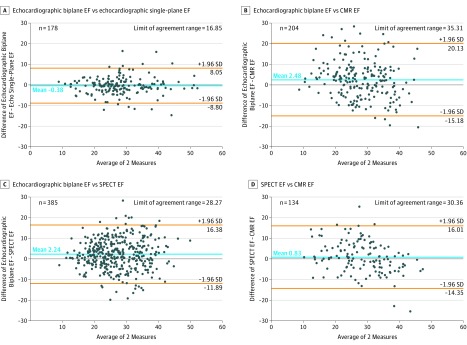
Figure. Bland-Altman Plots for Left Ventricular Ejection Fraction (EF).
Plots are compared for biplane Simpson method and visual estimation for echocardiography (A), biplane Simpson method by echocardiography and gated single-photon emission computed tomography (SPECT) (B), biplane Simpson method by echocardiography and cardiovascular magnetic resonance (CMR) (C), and gated SPECT and CMR (D).

