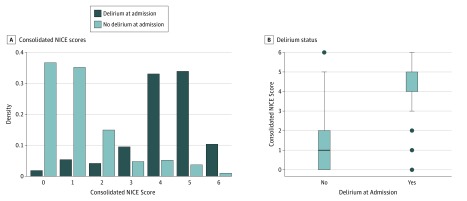
Figure 2. Comparison of the Consolidated National Institute for Health and Clinical Excellence (NICE) Score and Delirium Status.
A, The density histograms provide a probability breakdown of the consolidated NICE score by delirium status. B, The box plots show the association between the consolidated NICE score and delirium status in the derivation cohort. Center line in box indicates median; lower box border, 25th percentile or quartile 1; upper box border, 75th percentile or quartile 3; lower whisker, quartile 1 – 1.5 × interquartile range; upper whisker, quartile 3 + 1.5 × interquartile range.

