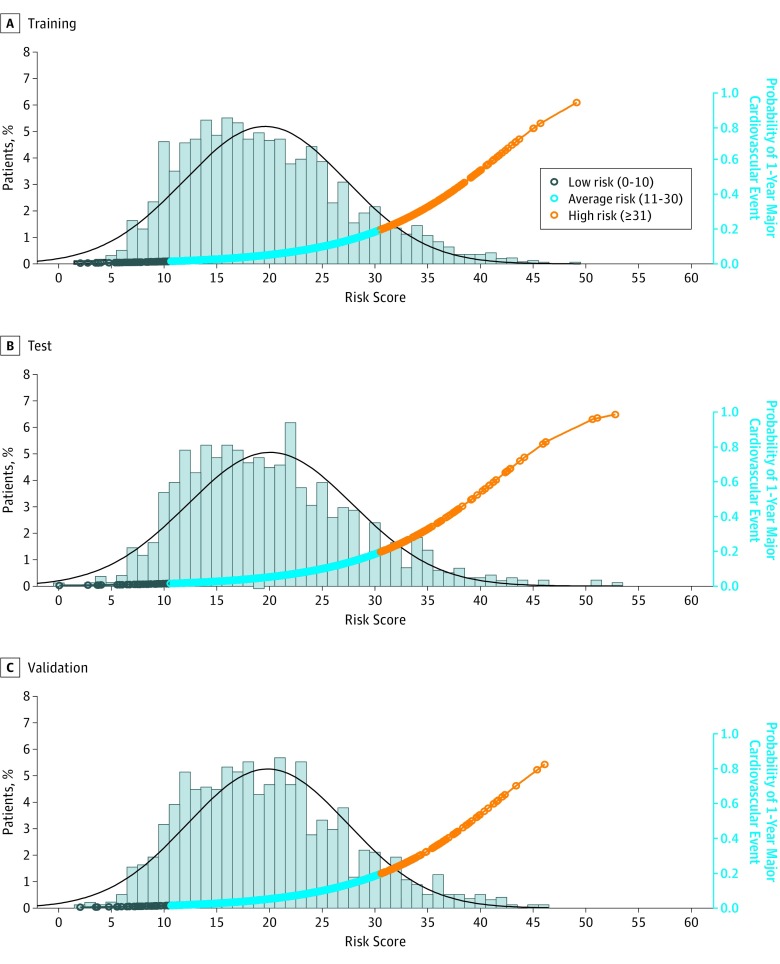
Figure 1. Distribution of Patient Risk Scores and Probability of 1-Year Major Cardiovascular Events by Risk Score.
The histograms show the distribution of risk scores for training (A), test (B), and validation (C) samples, and the curves show the probability of major cardiovascular events at 1 year. The black curve represents a fitted density curve on the risk score histogram. A risk score, ranging from 0 to 100, was constructed at the patient level based on the regression coefficients estimated from the final risk model with the training sample. A higher risk score indicates a higher probability of major cardiovascular events 1 year after discharge.

