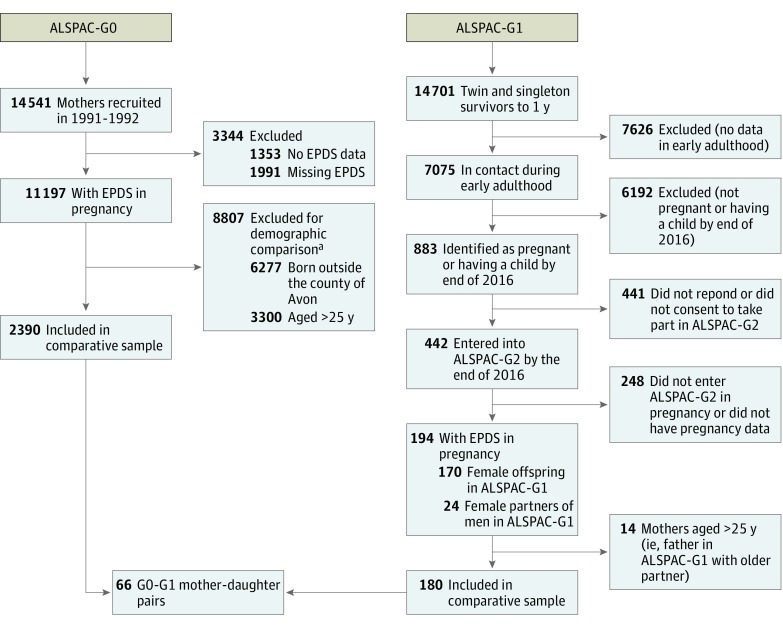
Figure 1. Flow Diagram Describing Numbers of Participants in Both Generations With Varying Data.
ALSPAC-G0 indicates original participants in the Avon Longitudinal Study of Parents and Children; ALSPAC-G1, offspring of ALSPAC-G0; ALSPAC-G2, offspring of ALSPAC-G1; and EPDS, Edinburgh Postnatal Depression Scale.
aIndividuals could be excluded for more than 1 reason.

