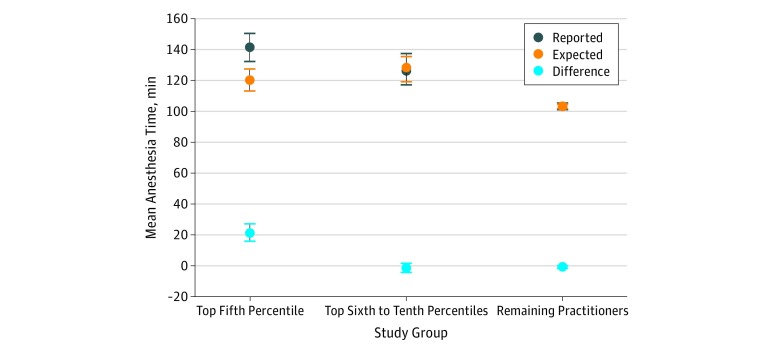
Figure 2. Reported and Expected Anesthesia Times and the Mean Difference Between the These Times for Each Study Group.
Anesthesia practitioners were classified into 1 of 3 groups based on the extent to which their reported anesthesia times ended in a multiple of 5 minutes (top fifth percentile, top sixth to tenth percentiles, and remaining practitioners). Error bars with 95% CIs are shown and are corrected for clustering within practitioners.

