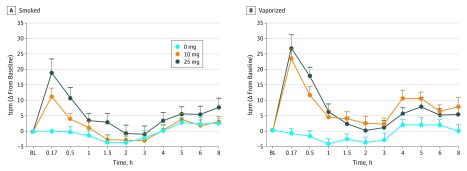
Figure 4. Mean Change From Baseline Score for Heart Rate Over Time, Displayed by Δ9-Tetrahydrocannabinol Dose for Smoked and Vaporized Conditions.
Error bars indicate SEM. Horizontal axes are not accurate time scales and represent the time points at which heart rate was measured. BL indicates baseline time point; bpm, beats per minute; and Δ, difference or change.

