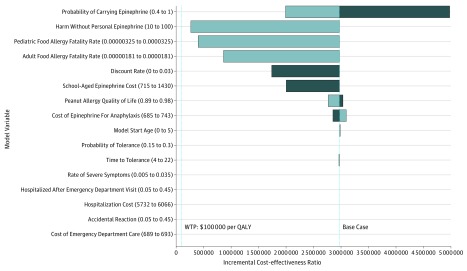
Figure 3. Tornado Diagram of Deterministic Sensitivity Analyses.
Dark bars denote values below the base-case assumptions and light bars denote values above the base-case assumptions. Values that deviate leftward of the base case do not cross the willingness-to-pay (WTP) threshold shown at $100 000 per quality-adjusted life-year (QALY). Values in parentheses on the y-axis represent the range of values simulated.

