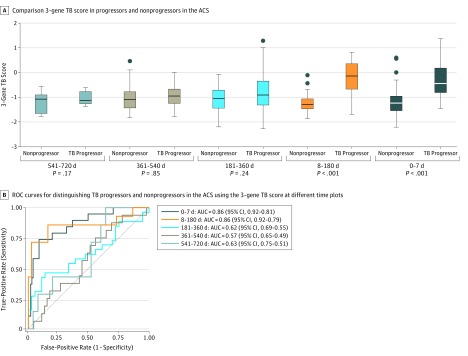
Figure 1. Association of the 3-Gene TB Score With Progression From Latent to Active Disease 6 Months Prior to Sputum Conversion in the ACS.
A, Box plots comparing the distributions of 3-gene tuberculosis (TB) scores between progressors and nonprogressors collected at 720 to 541, 540 to 361, 360 to 181, 180 to 8, and 7 to 0 days prior to sputum conversion. The horizontal line in the middle of each box indicates the median, while the bottom and top borders of the box represent the first and third quartile, respectively. The whiskers above and below represent the range of values. Circles indicate outliers. B, Receiver operating characteristics (ROC) curves for distinguishing progressors and nonprogressors prior to sputum conversion at different intervals. ACS indicates Adolescent Cohort Study; AUC, area under the curve.

