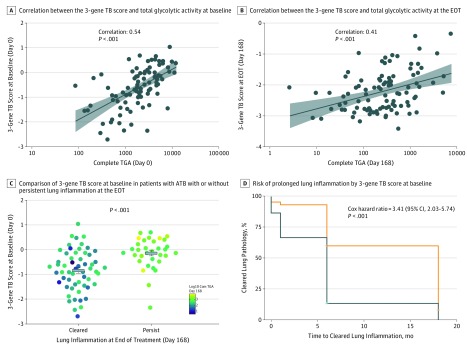
Figure 4. Correlation of the 3-Gene TB Score at Baseline With Severity of Lung Pathology and Treatment Response in the Catalysis Treatment Response Cohort.
A, The 3-gene tuberculosis (TB) score at baseline (prior to treatment initiation) in patients with active TB (ATB) correlated with total glycolytic ratio activity (TGA) at baseline. Each dot indicates a patient. Black line indicates linear regression. Shaded region indicates 95% CI. B, The 3-gene TB score at day 168 (end of treatment [EOT]) in patients with ATB correlated with day 168 TGA. Each dot indicates a patient. Black line indicates linear regression. Shaded region indicates 95% CI. C, The 3-gene TB score at baseline for patients with clear radiology by 6 months (mean, −0.84; 95% CI, −0.73 to −0.95) was significantly lower than those with persistent lung inflammation (mean, −0.16; 95% CI, −0.05 to −0.27). Each dot represents a patient. Color scale reflects log10 day 168 Total Glycolytic Activity Index score. D, Patients with ATB with 3-gene TB scores above the median had significantly higher likelihood of prolonged lung pathology as measured by positron emission tomography–computed tomography.

