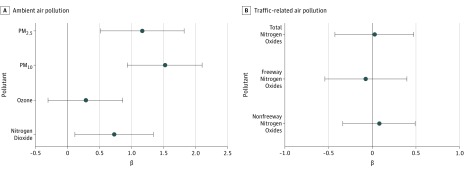
Figure 1. Individual Models for Pregnancy Averages of Air Pollutants.
β coefficients and 95% confidence intervals are shown for associations between pregnancy averages of ambient (A) and traffic-related (B) air pollution exposures and newborn blood spot total thyroxine concentrations. Pollutants were evaluated in individual models using linear regression. All models were adjusted for newborn’s sex, newborn’s race/ethnicity, gestational age at birth, season of birth, maternal parity, maternal age, maternal education, maternal tobacco smoke use during pregnancy, age at newborn blood spot collection, and the community of the participant at recruitment. The β coefficient represents the difference in total thyroxine (micrograms per deciliter) for a 2-SD difference in the pollutant. Analysis included 2050 participants for particulate matter with a diameter less than 10 μm (PM10), nitrogen dioxide, and ozone; 2046 participants for particulate matter with a diameter less than 2.5 μm (PM2.5); and 1989 participants for total, freeway, and nonfreeway nitrogen oxides.

